Class snapshot
Statistics are for the current class of first-year veterinary students.
2504
Applicants
19-38
Age Range
Average age: 23
States represented
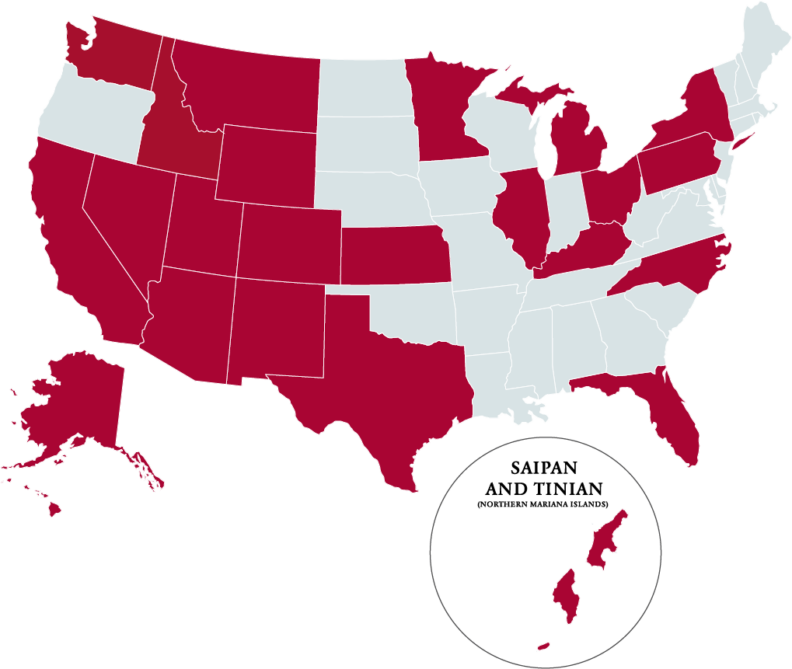
Statistics are for the current class of first-year veterinary students.